Visualization Tools
We prepared two types of figure.
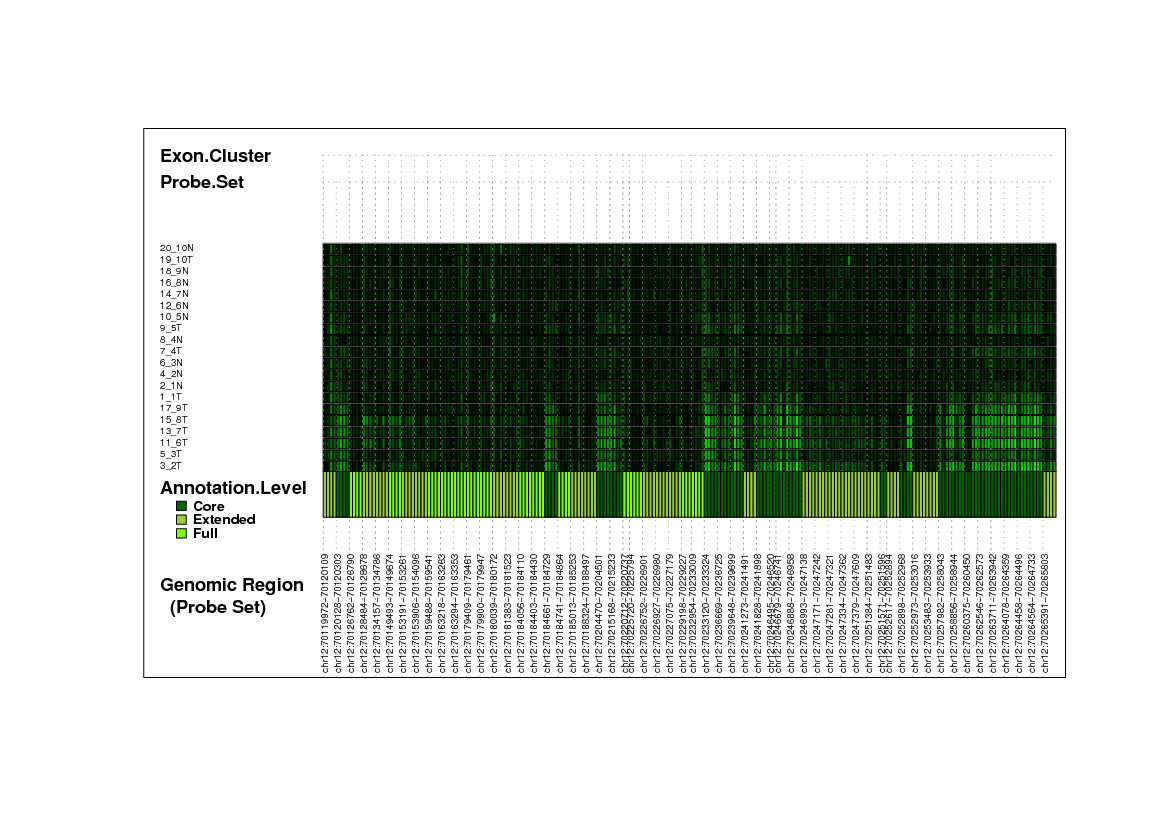
Heatmap for exon array data
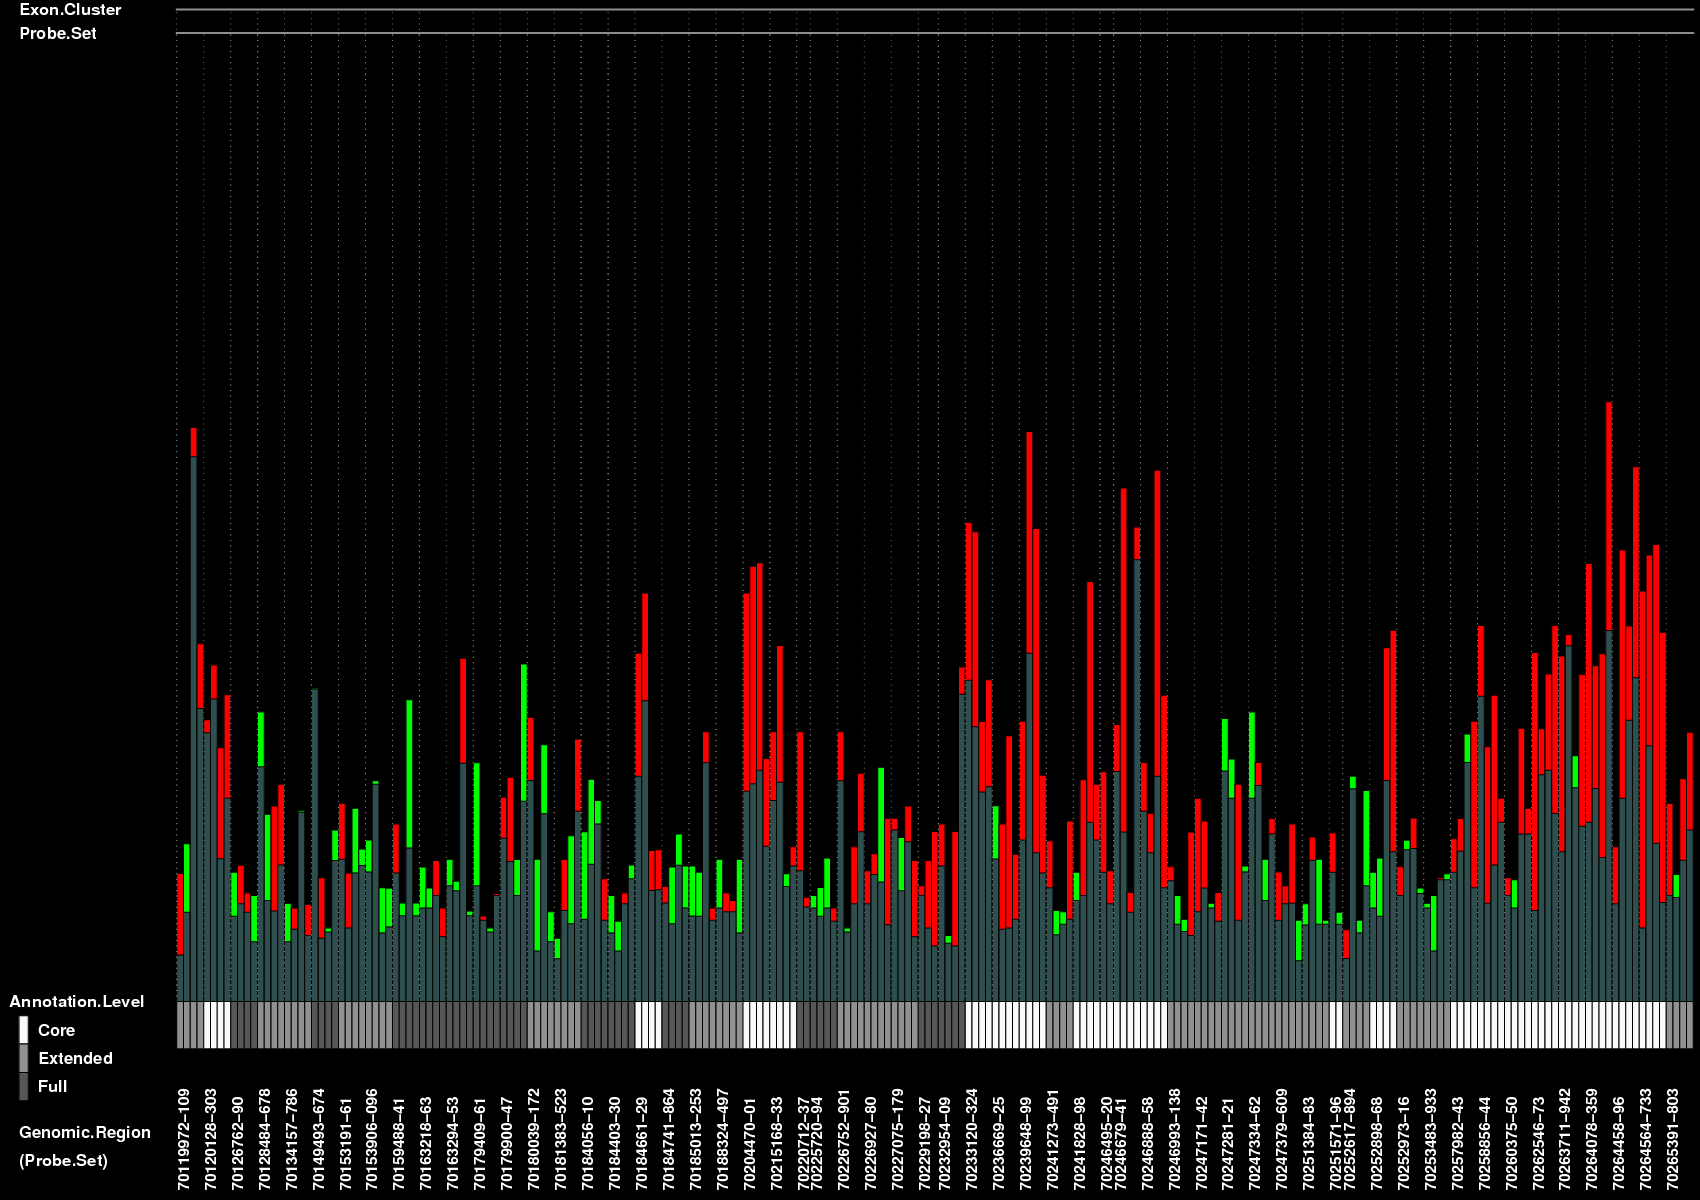
Barplot for exon array data
Back to the overview page