
This web page shows an example of exon array data of colon cancer. The data is a demo data provided from Affimetrix. The two-way ANOVA analysis, which is implemented in ExonMiner, was perform to this dataset. This analysis was done and shown in Yoshida et al. (2007) Computational discovery of aberrant splice variations with genome-wide exon expression profiles. Proc. IEEE 7th International Symposium on Bioinformatics & Bioengineering, 715-722.
We present here the potential of the proposed method along with the analysis of colon cancer data. Among over 300,000 transcript clusters, we focus on 69,206 clusters which contain two or more exonic regions.
After applying the whole transcript analysis, including the data preprocessing, the Bootstrap ANOVA and the normal inversion method, the integrated p-values are assigned to the transcript clusters. Here, we discuss the multiple hypothesis testing. Because we repeatedly apply the statistical tests across approximately 70,000 features, the method involves multiple comparisons, and the computed p-values should be interpreted accordingly while determining the threshold of the p-values. One key task in the multiple comparisons is to determine an appropriate rejection region for the tests so as to control the expected number of false positives in the rejected null hypotheses. Recently, a variety of false discovery rate (FDR) methods have been proposed in statistical literature [8], [9]. One of the most popular methods might be the positive FDR (pFDR) method, which was proposed by Storey [9].
One major difficulty in the pFDR method is the estimation of π0 without knowing the distribution of truly alternative pvalues. However, by using the distribution of the computed p-values, π0 might be reasonably estimated. Figure 1 displays a density histogram of the 69,206 integrated p-values which were computed in the analysis of specific splice variations (Test 3) using colon cancer data. From this figure, the following facts may be observed; (1) Frequency of the small p-values close to zero is very small compared to the other pvalues. (2) As the p-values increase, e.g. beyond 0.7, height of the histogram becomes exponentially larger. These observed facts suggest that π^0 ≈ 1 is a reasonable estimate. For genome-wide expression analysis, because genes involved in the same pathway behave dependently, the significance tests are not statistically independent of each other. For example, it is generally assumed that the transcriptional activity ofmost housekeeping genes is not affected by experimental conditions, e.g. it is independent of whether cells are tumorous or not. The presence of a large number of transcript clusters giving p-values close to one may be a natural consequence of the fact that most splice reactions are invariant between tumor and normal cells, and specific splice mutations are induced at a very small region in the entire loci. Further, Storey [9] provided the statistical validity of using pFDR under weak dependence of the features and accordingly concluded that under mild conditions, the pFDR approaches the form observed under independence as the number of tests increased. For these reasons, we decided to apply the pFDR measure with π0 = 1 in order to make the testing principle conservative.
The method identified 83 loci as generating tumor-specific splicing variations by setting the acceptable FDR to less than 10%. Table I (see also Supplementary Table 3) shows some of the significant genes for interaction parameters in which the 36 genes shown in the table are those annotated by the NCBI references (RefSeq ID), the other genes are not. The complete tables, which include the individual and the integrated pvalues, and the estimated FDRs of all transcript clusters analysed, are also available at Supplementary Information site.

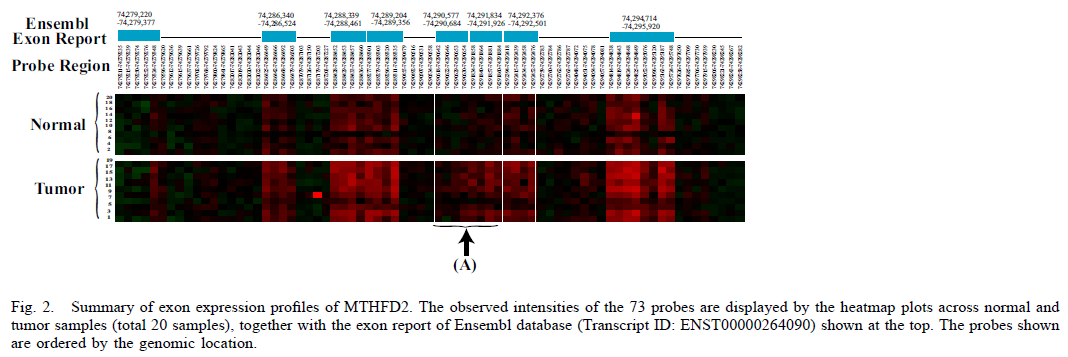
The most significant gene was MTHFD2, which codes for the bifunctional methylenetetrahydrofolate dehydrogenase/cyclohydrolase and mitochondrial precursor proteins. This gene plays a role in the maintenance of the single carbon metabolic pool carried by folate. Folate could be involved in colorectal carcinogenesis through DNA methylation and polymorphisms in the genes involved in folate metabolism [10], [11]. Figure 2 shows the heatmaps of the 73 probe intensities of MTHFD2 across the normal and the tumor samples (total 20 samples) with the eight exonic regions which are reported in Ensembl release 41 (http://www.ensembl.org/index.html). We use this plot for understanding the observations in relation to known splice events. While the eight exonic regions are currently reported in Ensembl, some exons are likely to be omitted specifically for normal cells. Notably, the 5th and the 6th consensus exons are differentially expressed between cells with different phenotypes. In these genomic regions (74,290,577 - 74,291,926), the exons are expressed in tumor cells, but absent in normal cells (see Figure 2(A)).
We next focused on LGR5 (GPR49) which codes leucinerich repeat-containing G protein-coupled receptor 5. Figure 3 displays the four splice isoforms, which are registered in the AltSplice database, and the observed intensities of the 225 probes. According to the Ensemble database, this gene is composed of the 18 exons. The exon expression patterns shown in Figure 3(A) suggest that a part of the first exonic regions 70,120,031 - 70,120,339 is spliced out during alternative splicing.
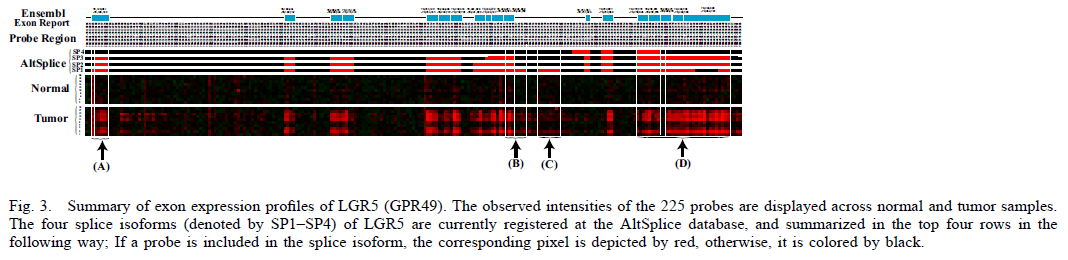
Further, in AltSplice, some splice events are stated, for example, alternative donor with the isoforms, 70,246,889 - 70,246,960 and 70,246,889 - 70,247,144, and cassette exon corresponding to 70,247,264 - 70,247,363. Regarding the former splice event, the probe intensities between two adjacent genomic regions, i.e. 70,246,889 - 70,246,960 and 70,246,889 - 70,247,144 (Figure 3(B)), are clearly different in most tumor cells. This observed fact indicates the presence of an alternative donor at these regions. With respect to the cassette exon (70,247,264 - 70,247,363), the corresponding probe intensities shown in Figure 3(C) are low across all samples.
LGR5 is a member of the glycoprotein hormone receptor subfamily which includes the thyroid-stimulating hormone receptor (TSHR), follicle-stimulating hormone receptor (FSHR), and luteinizing hormone receptor (LHR). According to Yamamoto et al. [12], overexpression of LGR5 was frequently observed in hepatocellular carcinoma with a mutation in beta-catenin exon 3 (14 of 16 cases, 87.5%). Moreover, the introduction of mutant beta-catenin into mouse hepatocytes in culture caused up-regulation of the LGR5 mouse homologue. Based on the observed facts, they concluded that LGR5 is a target gene activated by Wnt-signaling. Wnt signaling is known to trigger the destabilization of free cytoplasmic beta-catenin. In addition, the beta-catenin is involved in both cadherinmediated cell-cell adhesion. Recently, it has been discovered that aberrant activation of beta-catenin contributes to the onset of a variety of tumors, particularly, colorectal carcinoma [13], [14]. We therefore discuss the identified genes with significant specific splice variations in relation to the canonical Wnt signaling pathways.